
Craps Tips Video Source:
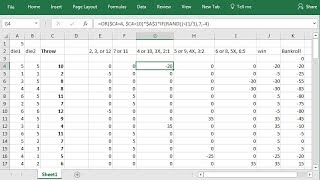
This Excel spreadsheet simulates a 400-bet session of the craps Pass bet taking maximum odds 3X-4X-5X, which is the best craps strategy. You can easily win or lose $500 or $1,000 betting the $5 minimum and taking $15-$20-$25 odds bets, as demonstrated in the simulation.
This is Part 2, which shows how create the spreadsheet, step by step. Part 1 is the demo:
Here are the equations to insert into row 4:
A4 (die1): =TRUNC(RAND()*6)+1
B4 (die2): =TRUNC(RAND()*6)+1
C4 (Throw): =A4+B4
E4 (7 or 11): =OR($C4=7, $C4=11)*$A$1
F4 (2, 3, or 12): =OR($C4=2, $C4=3, $C4=12)*$A$1*-1
G4 (4 or 10, 3X, 2:1): =OR($C4=4, $C4=10)*$A$1*IF(RAND()[less-than](1/3),7,-4)
H4 (5 or 9, 4X, 3:2): =OR($C4=5, $C4=9)*$A$1*IF(RAND()[less-than](2/5),7,-5)
I4 (6 or 8, 5X, 6:5): =OR($C4=6, $C4=8)*$A$1*IF(RAND()[less-than](5/11),7,-6)
YouTube won’t let me put the “less-than” character in the description, so I show it as [less-than]. It is the left-pointing carat symbol, or left angle bracket.
J4 (win): =E4+F4+G4+H4+I4
K4 (Bankroll): =K3+J4
You can enter your actual starting bankroll in cell K3 instead of 0, for example, enter $500 if that is your actual bankroll. Then you can watch your bankroll grow and shrink, and maybe get wiped out.
Also, you can change the value in cell A1 to simulate a different starting bet. For example, enter 10 in that cell, and you see the results of betting $10 on Pass and $30-$40-$50 on the point.
If you have some kind of betting strategy based on previous results or streaks, you can simulate it by putting the logic in a new column in the spreadsheet. Then use that value as the starting bet for the next row instead of using cell $A$1.
If you want to simulate the Don’t Pass bet and laying maximum odds on that bet, make the following changes to the equations:
E4 (7 or 11): =OR($C4=7, $C4=11)*$A$1*-1
F4 (2 or 3): =OR($C4=2, $C4=3)*$A$1
(Throwing 12 is a tie, resulting in zeros in all result columns)
G4 (4 or 10, 3X, 1:2): =OR($C4=4, $C4=10)*$A$1*IF(RAND()[less-than](1/3),-7,4)
H4 (5 or 9, 4X, 2:3): =OR($C4=5, $C4=9)*$A$1*IF(RAND()[less-than](2/5),-7,5)
I4 (6 or 8, 5X, 5:6): =OR($C4=6, $C4=8)*$A$1*IF(RAND()[less-than](5/11),-7,6)
In laying the odds on Don’t Pass, the maximum bet is 6X with payoffs of 3X-4X-5X.
Part 3 shows you how to graph the results, with and without taking the odds bets:
Source: YouTube


Hi , thank you for spending time to make and post this video !
My question is – Is the law of large numbers applies using the random number generator for the both die separately as the most common combination of the dice is 7 and that combination should appear statistically every 6 rolls as per that law.
Would be nice to have an option where one can play with different ratios. For example, I would like to see how the P/L changes if I can roll 7 on average every 7 or 8 rolls statistically.
Regards : si
I don't think this is a good representation of dice roll using RANDOM. Your charts will be different if you truly use the stats of a die being rolled. With 2 die 7 will appear much more than 12 and 2. 7 should appear 6 times out of 36 rolls and 2,12 should only show up 1 of 36 rolls (on avg). So the random function is NOT good